The Color drop zone drives the color logic of the visualization, assigning colors based on the given hierarchy or measure. The color function behaves differently depending on whether a hierarchy or a measure is selected as the color driver. When a chip is added to the Color zone, the corresponding legend is added to the canvas; the colors in the series can then be edited from the legend or formatting panel as required.
Conditional Formatting
Depending on both the given visual and chip type, the Color drop zone also presents users with the flexibility to choose the color target in the visual (that is, which component of the visual the color logic will be applied to), and the actual logic. This is a mechanism to drive conditional formatting logic for all visuals allowing users to formulaically color the data points with logic like averages, linear scale, or percentiles.
Note: This conditional capability is not exclusive to the Color Drop Zone - working equally well with the Indicator drop zone. It can also be enacted from various entry points, like the Conditional Formatting context menu or dialog.
Color Chips
Both hierarchies and measures can be added to the Color drop zone, where they will drive the color component of the visual.
Hierarchies
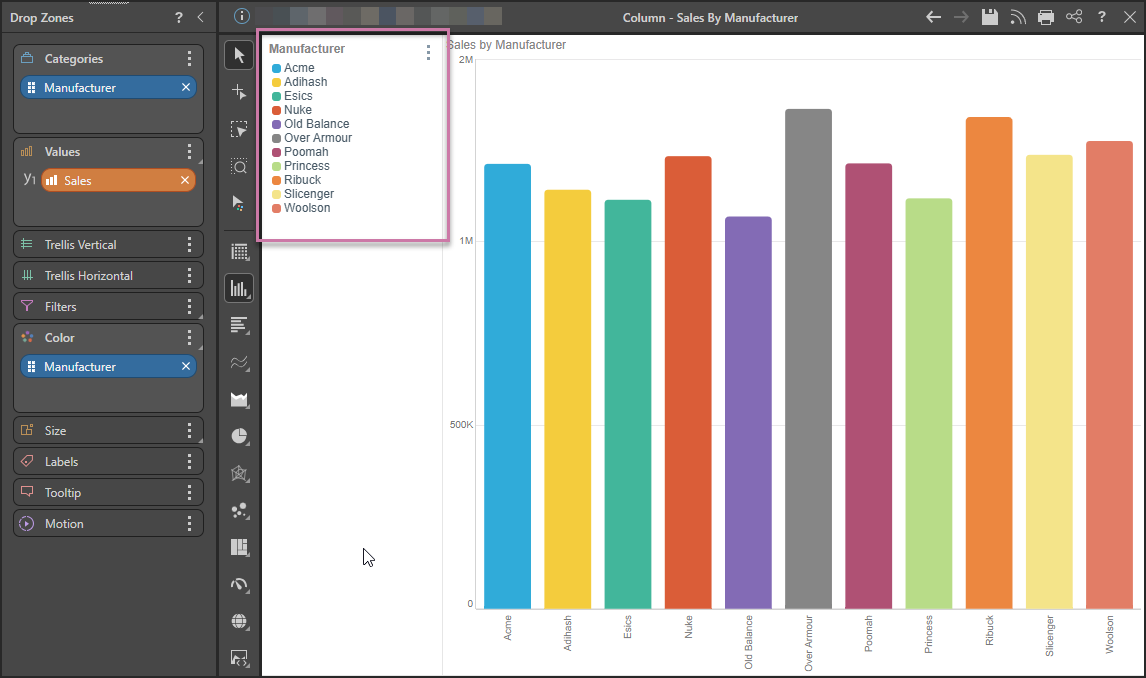
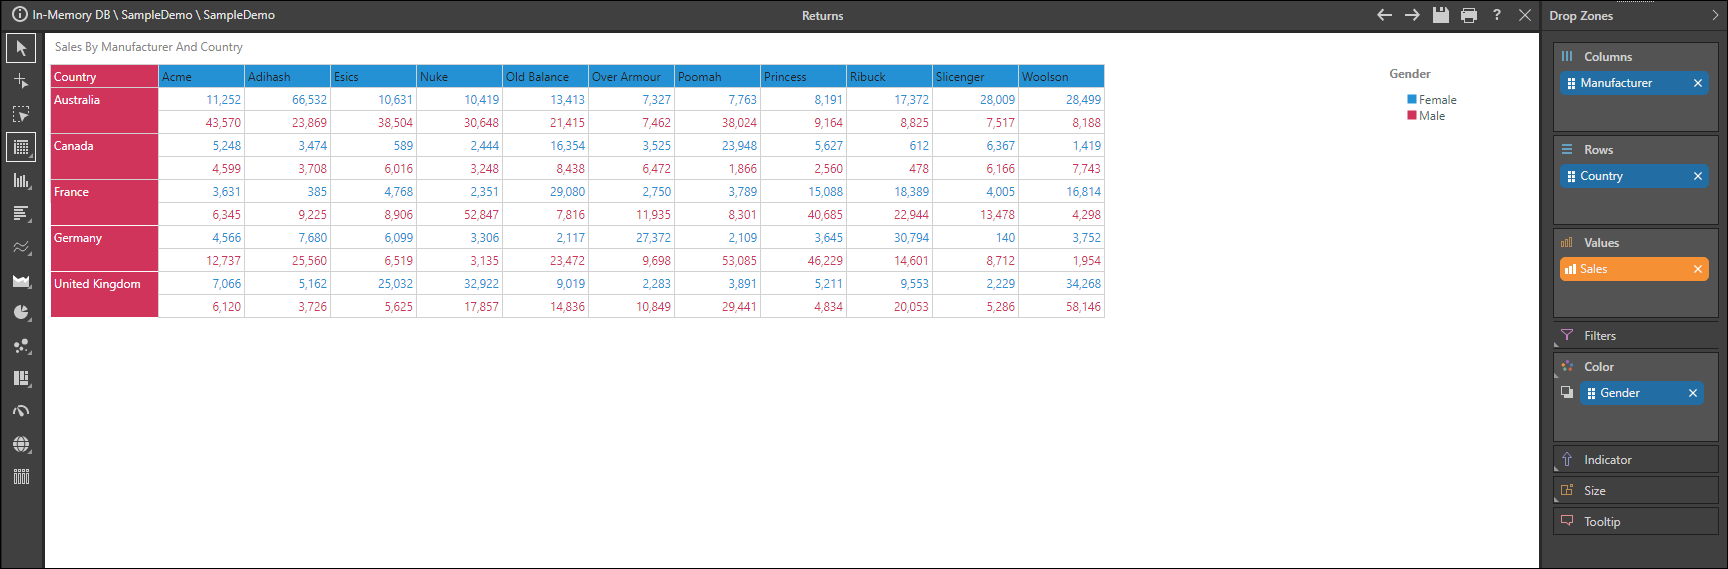
When a hierarchy is added to the Color zone, the visualization will be colored according to the member elements in that hierarchy and a discrete legend (purple highlight) is produced:
Color Locking
When colors are set for hierarchical / blue chips, the engine uses the color palettes set in the themes. The allocation is done dynamically in the element order generated by the query (or the data model). If the query changes, the allocation is reset and the colors of elements within the same report may change.
Tip: To avoid this automated color switching, you can use the Member Color Lock. This ensures that the colors of items are "remembered" within a given report, regardless of any subsequent changes.
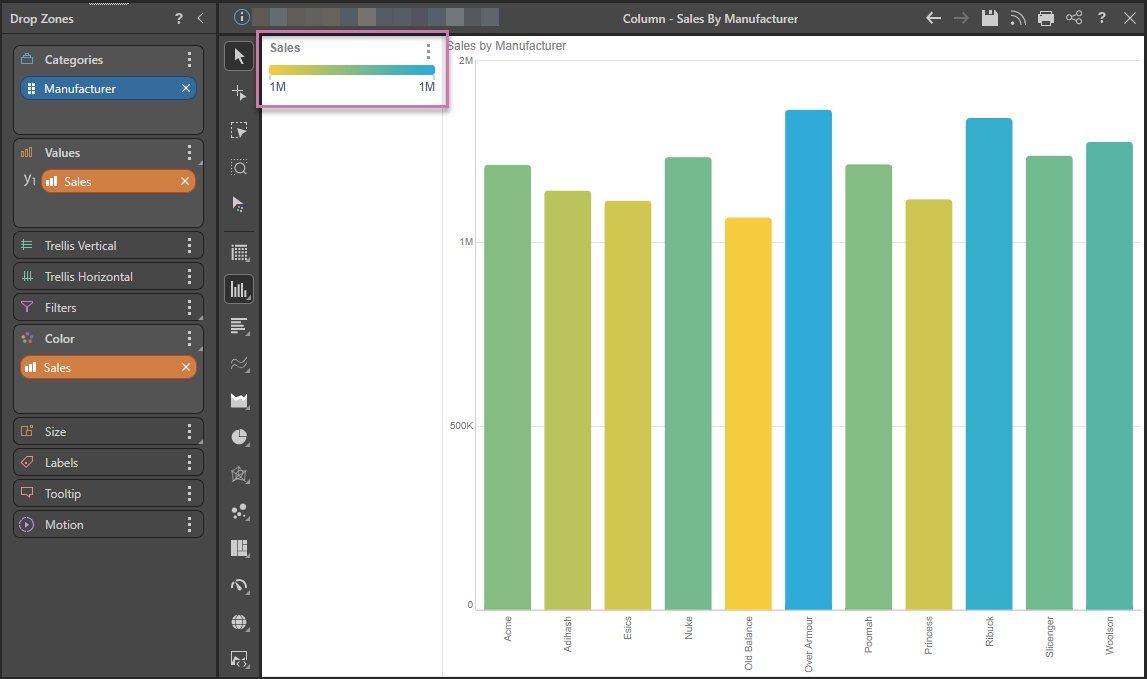
Measures
When a measure is added to the Color zone, the visualization is colored according to the range of values for that measure in the context of the query. This range is described by a continuous legend:
Conditional Formatting with Color
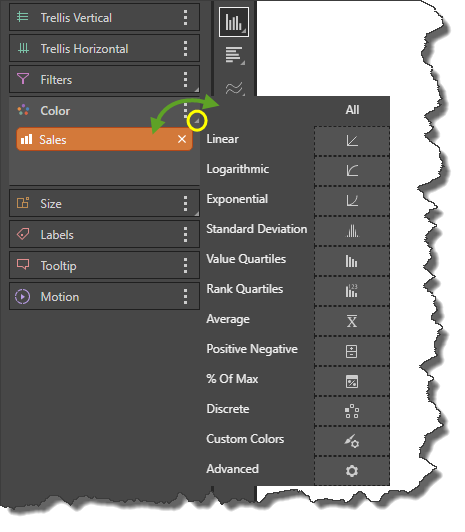
When a chip is added to the Color zone, you can open the Color submenu and select the type of logic that should be used to drive the color component of the visual. The submenu may be opened by dragging the chip over the Color zone header, or by clicking the expand button (yellow highlight below). This is one of the techniques for conditionally formatting your data points in a visual. This framework is part of a much larger set of capabilities under conditional formatting and for drop zones.
Color Targets
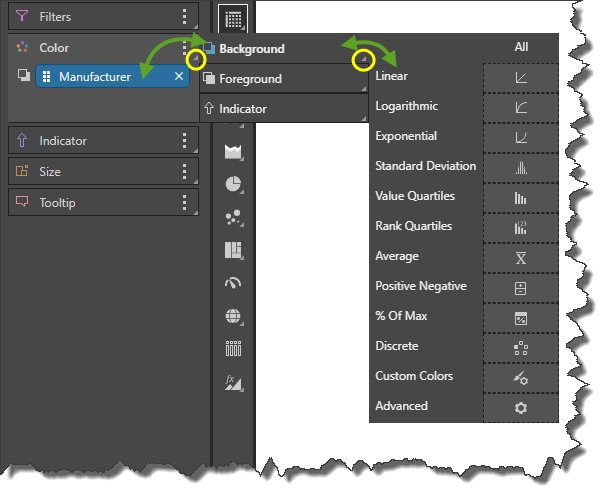
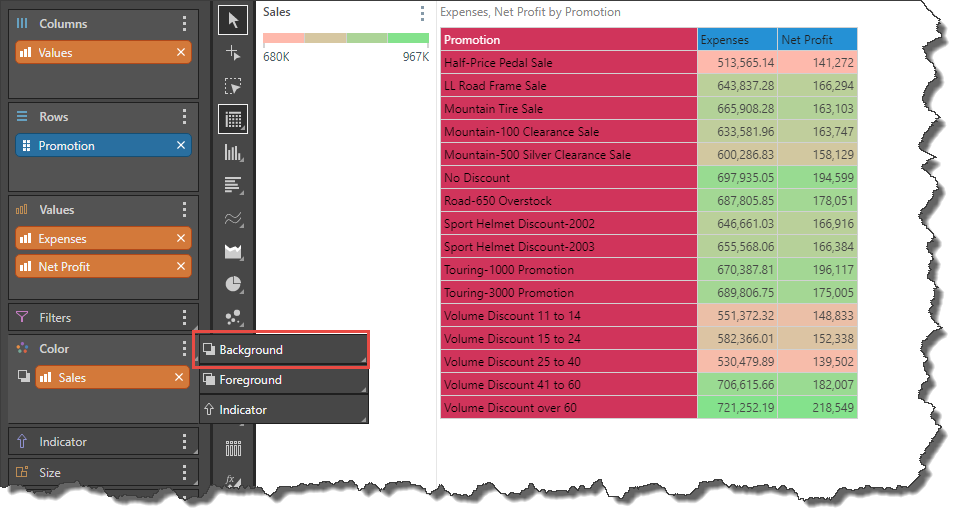
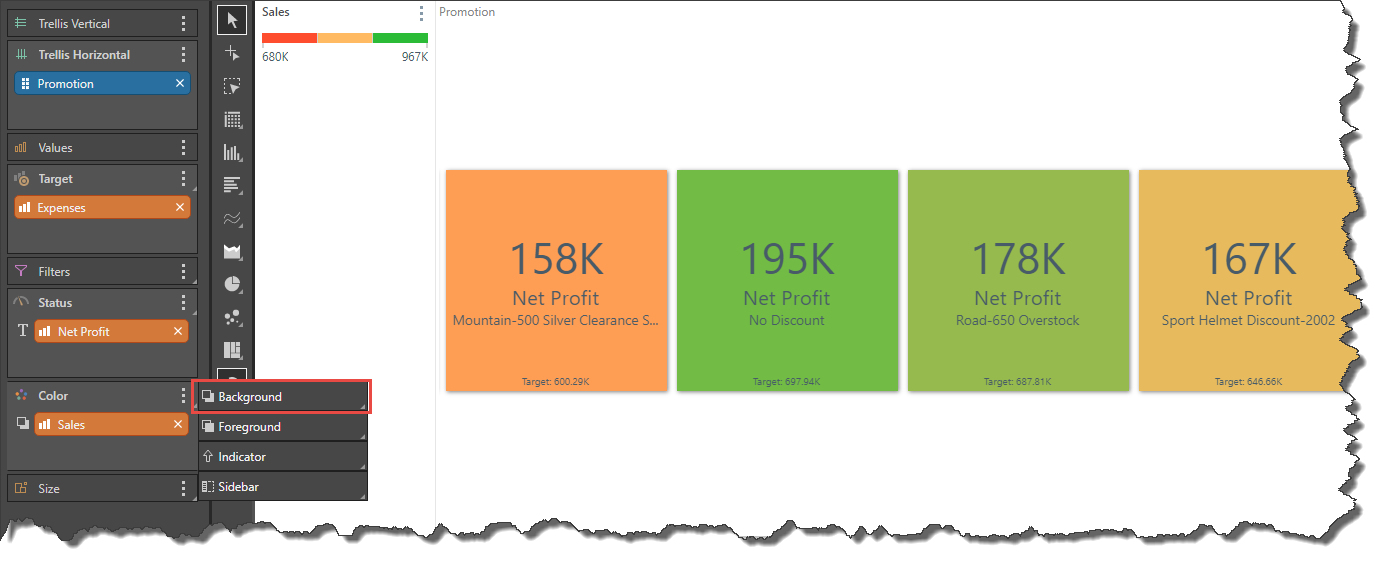
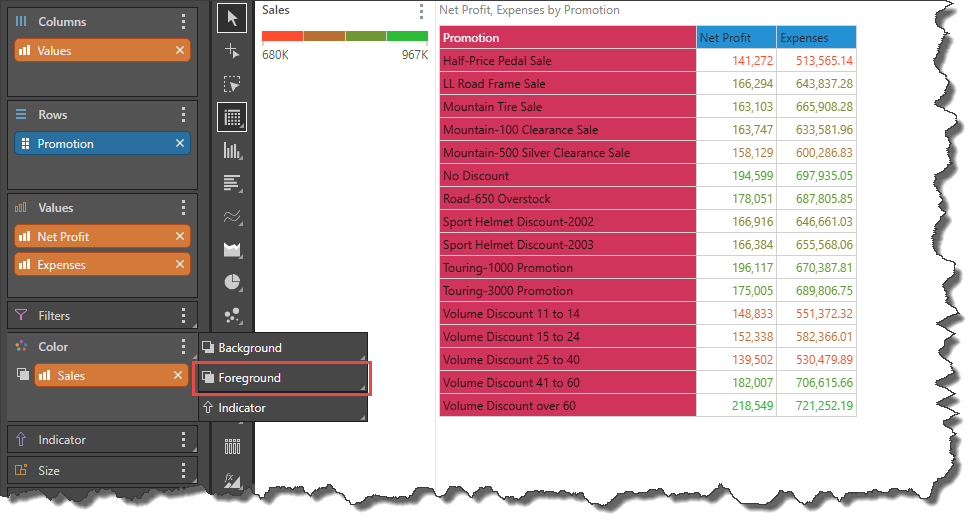
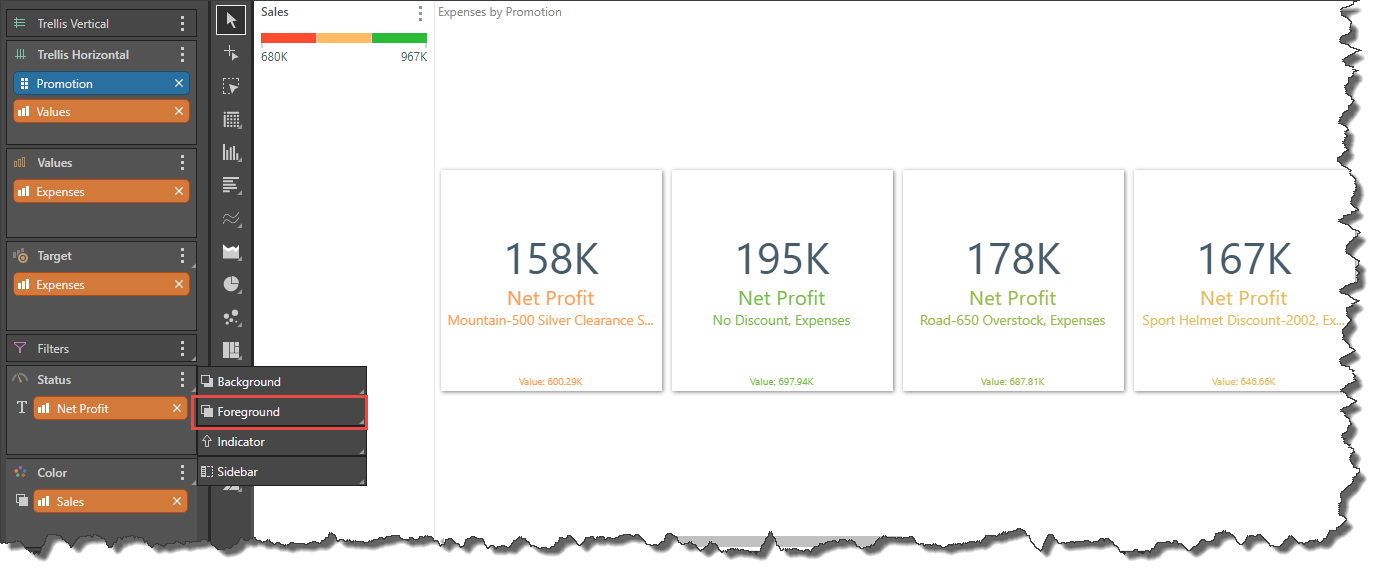
The option to select the color target (that is, the component of the visualization that will be colored) is presented when working with grids and gauges. The color target is selected from the Color submenu, which can be opened by dragging the chip over the Color zone header, or by clicking the expand button (yellow highlights below). Once a target is chosen the next submenu will open, allowing you to specify and logic type. This option does not apply to other visuals, since the "fill" or "background" option is the only available option.
Background may be selected as the target for both grids and gauges; selecting Background will apply the color logic to the grid's cells, or to the gauge's tile. This option is supported for both hierarchy and measure driven colors.
Grid
Gauge
Foreground can also be selected for both grids and gauges. If Foreground is chosen as the target, the given hierarchy of measure will drive the color of the text in each tuple of the visual.
Grid
Gauge
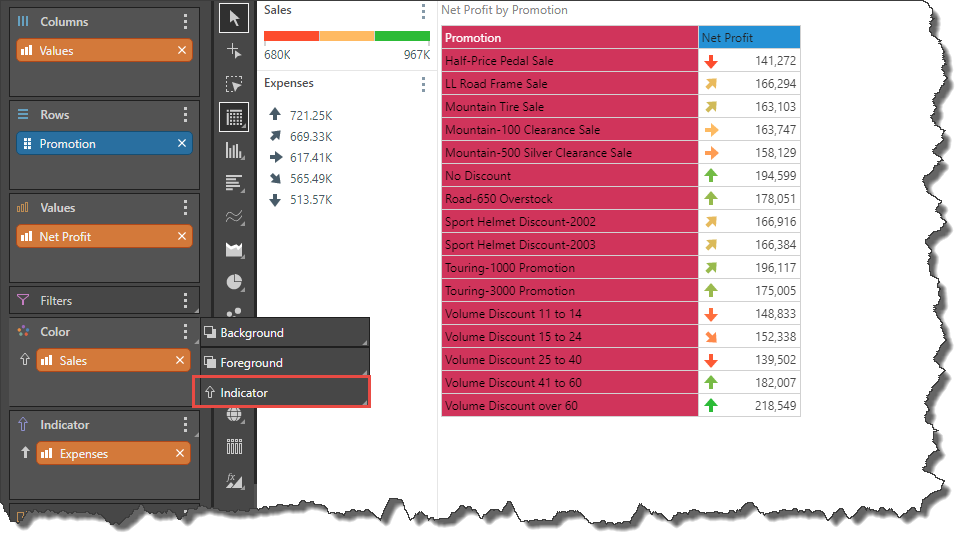
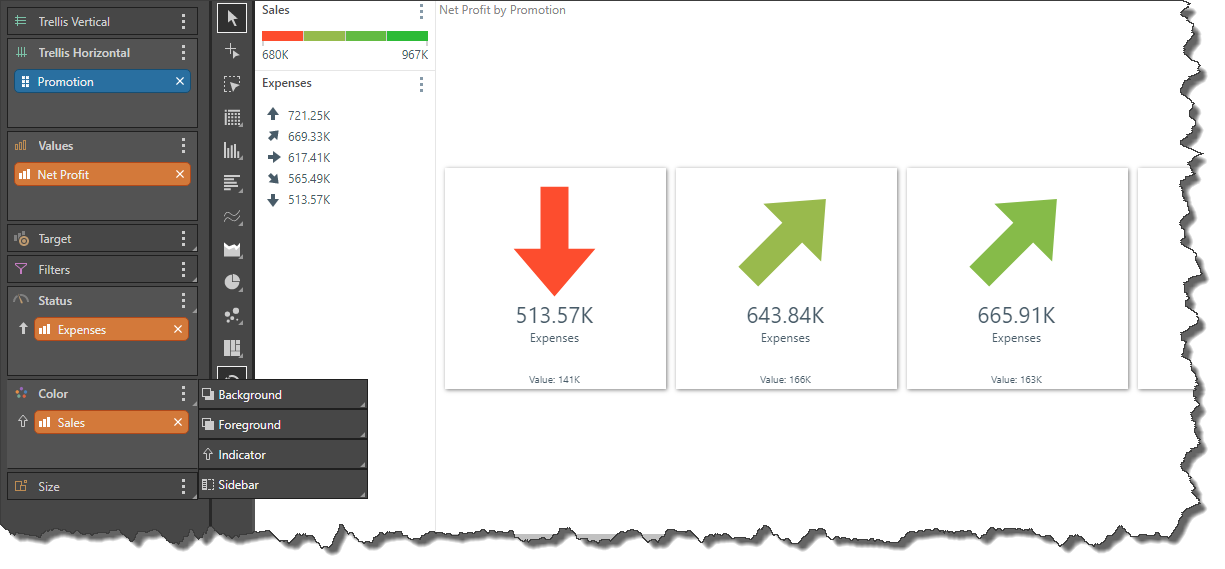
You can select indicators as the color target; once a measure has been a, the color of the indicators in the grid or gauge will be driven by the given measure (a hierarchy cannot be used to drive the indicator color).
Grid
Gauge
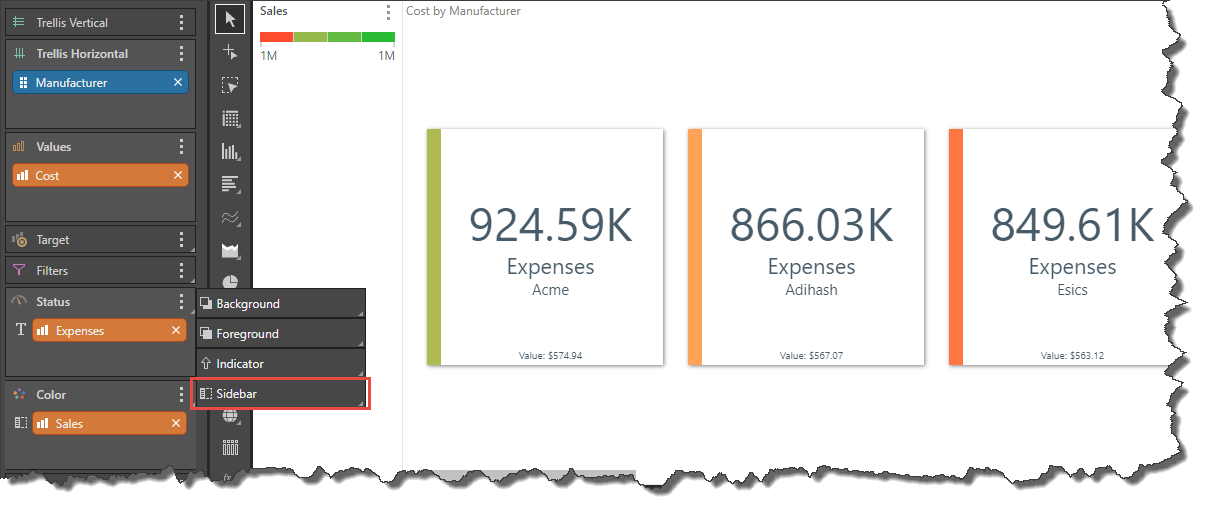
Sidebar
When working with gauges, you may select sidebars as the color target; the color of the gauges' sidebars will be driven by the given measure. Hierarchies cannot be used to drive sidebar color.
Examples
The examples show how the color drop zone can be used in a variety of visuals.
Add a hierarchy to the color zone to add a color component to the visual. This is particularly useful if the query contains multiple hierarchies.
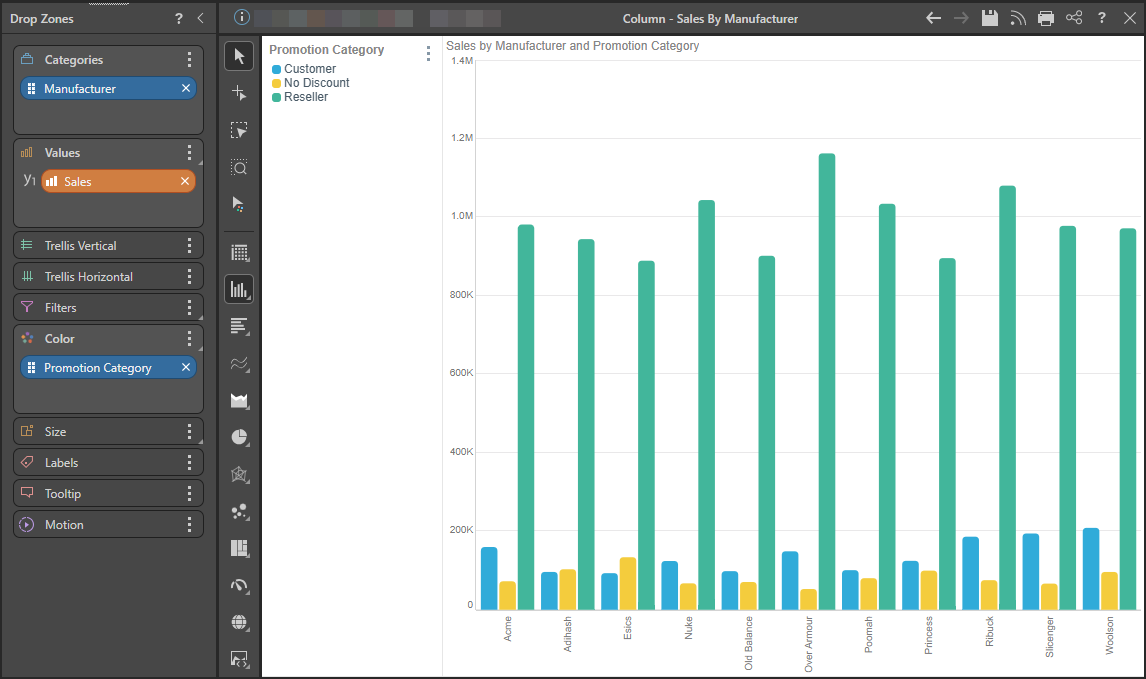
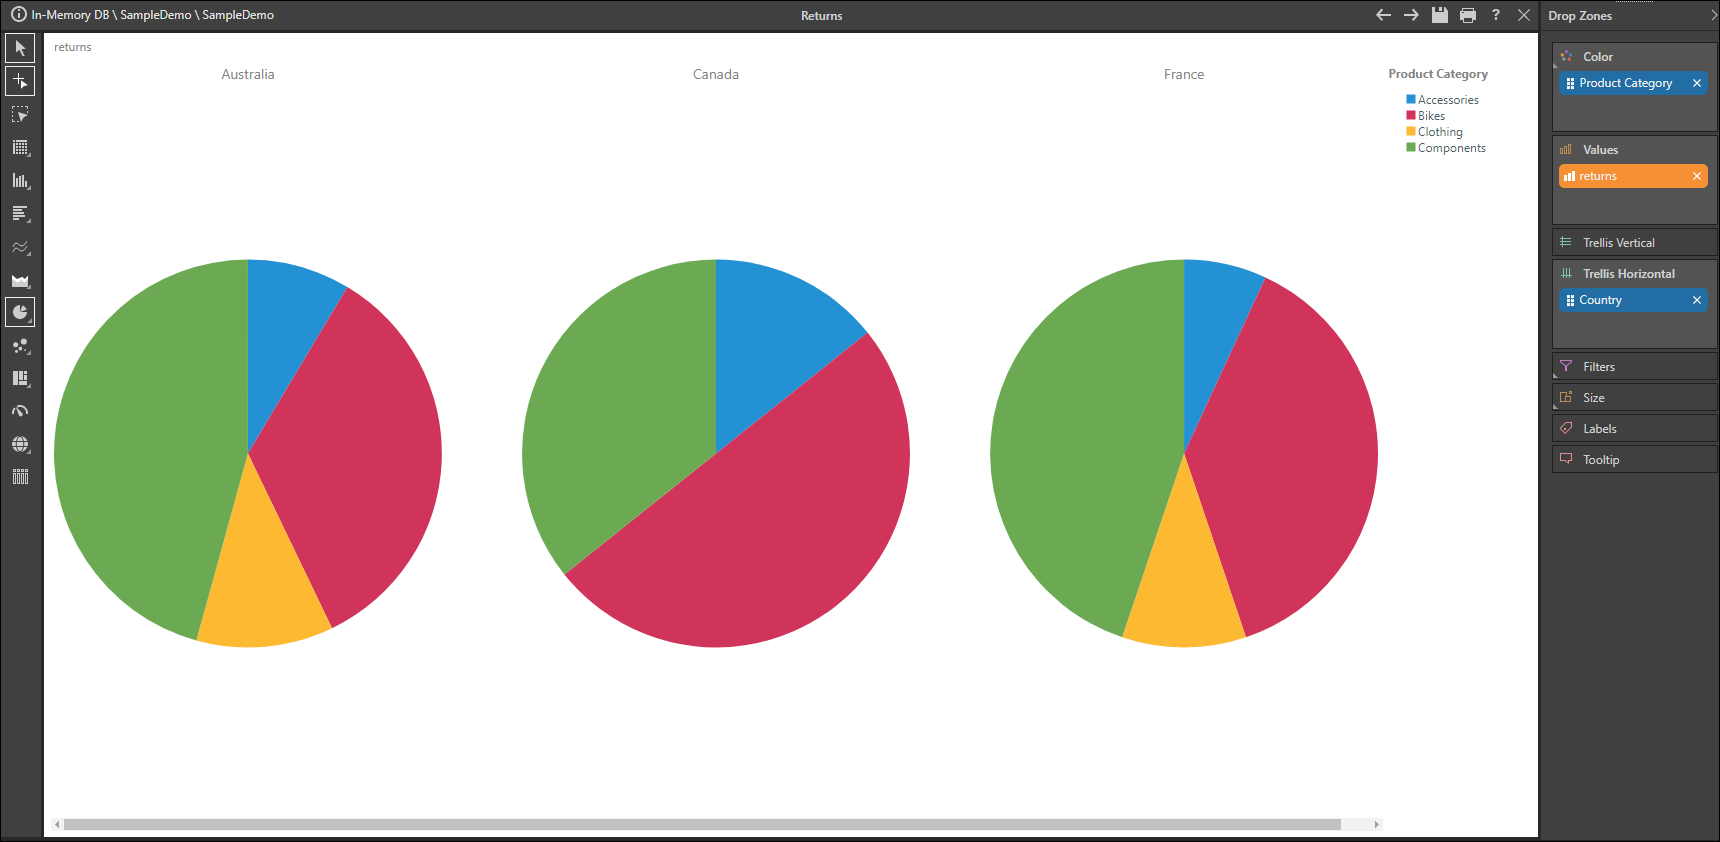
One hierarchy is added to Color, and a second to Trellis, to produce a series of pie charts (each one representing a different country) colored according to Product Category.
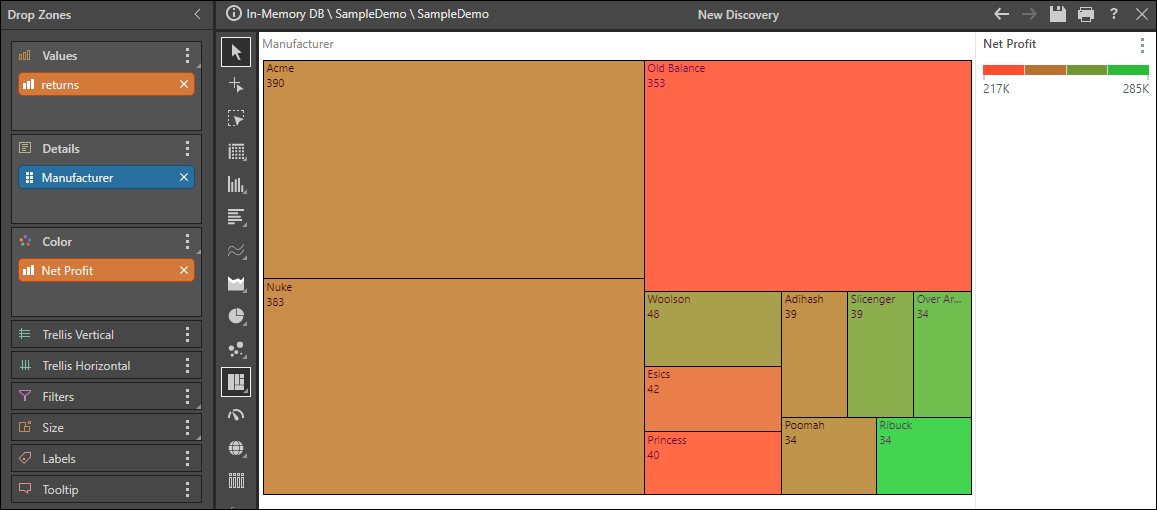
In this example, a tree map was built by adding a second measure (rather than hierarchy) to the Color zone. This produces a continuous legend that corresponds to the range of Net Profit values in the chart.
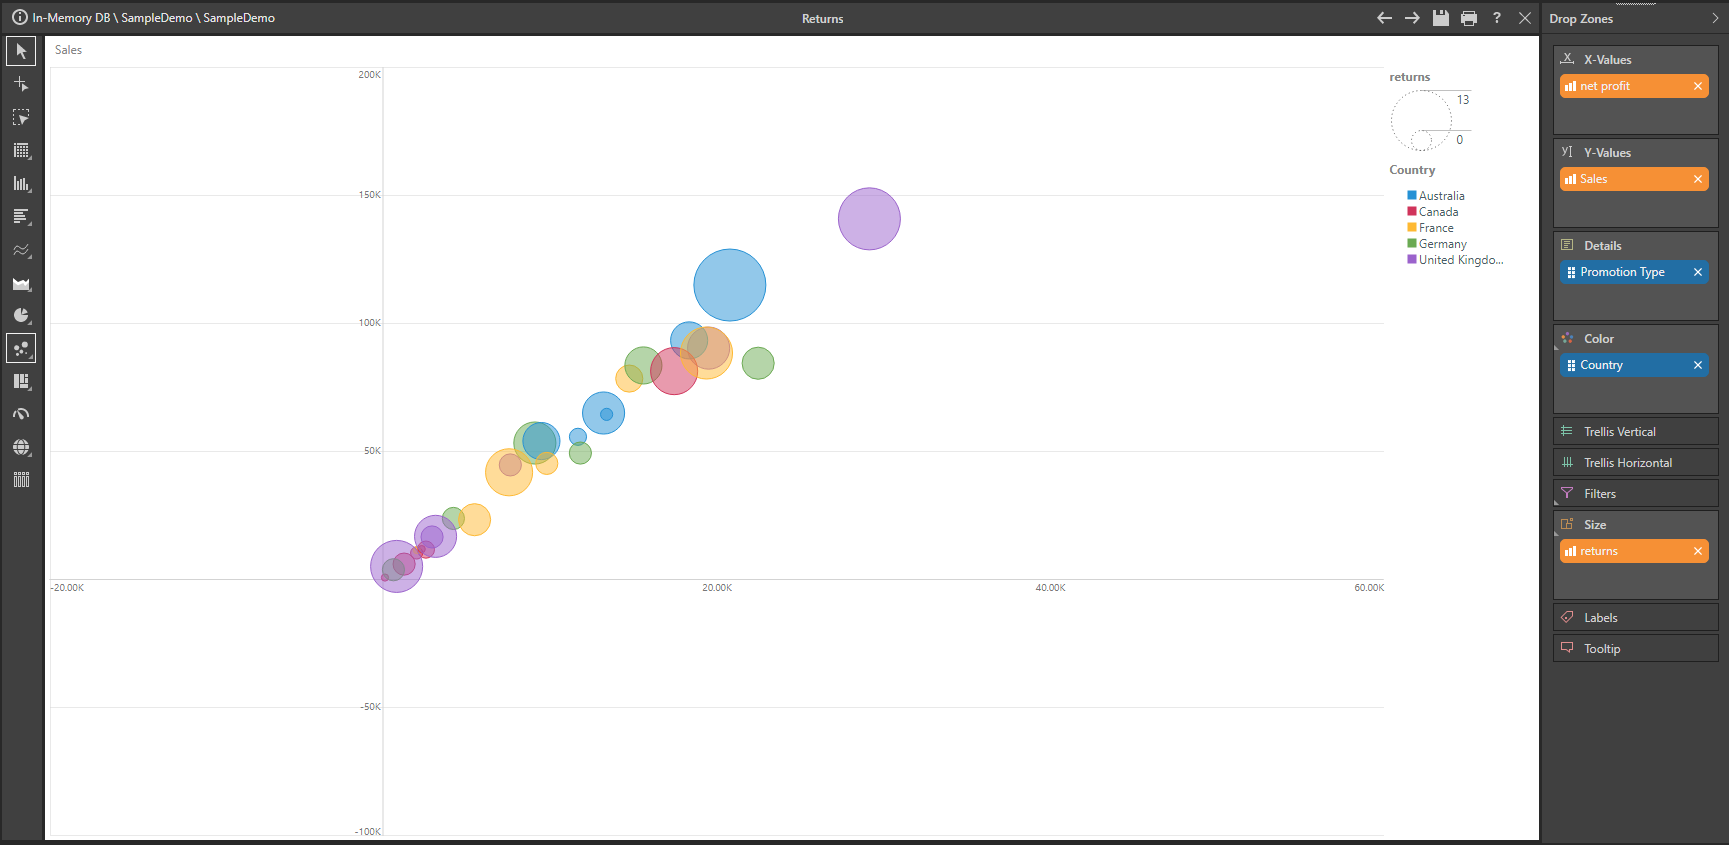
In this scatter chart, a second hierarchy (Country) is added to Color, while a third measure (Returns) is added to Size. The result is that the chart's bubbles are colored according to country, and sized according to the number of returns.
When leveraging the Color zone with grids, the blue chip can be added to the submenu under Foreground or Background:
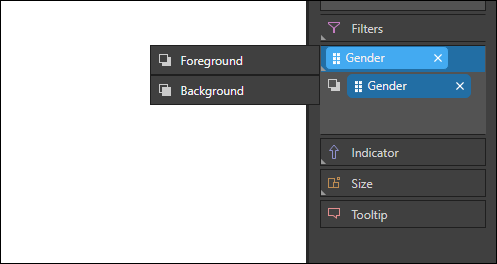
When added to Foreground, only the text will appear in color.
When added to Background, the cells will appear in color.
